

The Burning Platform
Demographics don’t lie. The governments of the world and their captured bureaucrats can manipulate inflation data, unemployment data, GDP data, and numerous other data based figures to make things appear better than they are. It’s called propaganda and manipulation to create a false narrative beneficial to their interests. But, demographic data can’t be massaged to provide a happy ending for the psychopaths in suits, running the show. They can ignore the data and pretend it doesn’t exist, but you can’t change the ages of the people inhabiting this planet.
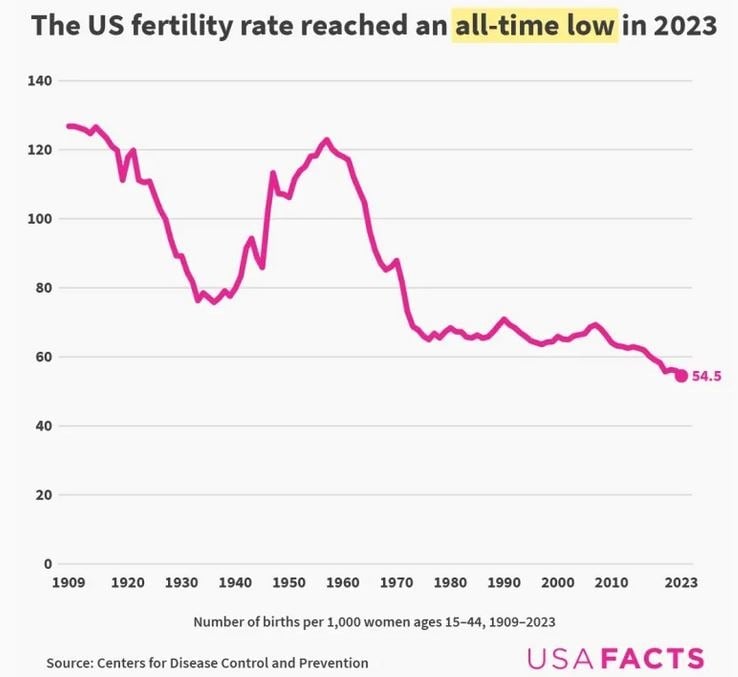
The data is dire for the Western world and Asia, particularly China, Taiwan, South Korea, and Singapore. The U.S. fertility rate is at an all-time low, down 55% from its peak in 1957. It is down 40% since the early 1970s, when women, brainwashed by feminist tripe, joined the workforce in droves, and murdered 63 million of their unborn children, in the name of women’s rights. This is what the woman’s movement, created by the globalist cabal to advance their agenda of destroying the western world and replacing it with their one world order, has wrought.
Their plan has been to replace the educated white people in western countries with low IQ 3rd world parasites, as a means to their end of controlling the masses in a digital prison of their making. Feminism was designed to convince women to stop having children, stop marrying strong men, and believing their lives were more fulfilled working 60 hours a week rather than raising children. The cultural destruction of America is almost complete.
Our globalist overlords have succeeded spectacularly in destroying the social fabric and community mores of our nation and other “developed” countries. And, as designed, the gene altering Pfizer/Moderna jabs are causing global fertility rates to plummet further, exacerbating the already dire trend. I wonder why very few 3rd worlders received the toxic covid jabs. Maybe the globalist controllers wanted to keep their fertility rates high.
The charts and maps below paint a bleak picture for the citizens of the world, but an absolute windfall for the totalitarians seeking to imprison us in their social credit, CBDC techno-gulag world of the future. The illiterate, mud hut dwellers are pumping out more illiterate 3rd worlders at a rate five to six times as high as the rich developed world countries. With a required replacement rate of 2.1, in order to maintain a static population, the U.S. and most of the countries in the developed world are in a self imposed death spiral. With 6,000 Boomers dying per day, the U.S. spiral is accelerating.
The elimination of high IQ, highly productive whites and Asians, and replacing them with low IQ parasitical african and muslim dregs, guarantees the degradation of our society, culture, and financial viability. The open borders and purposeful importation of the riffraff, scum and rabble from Africa and Middle East is part of the Great Reset agenda. The social welfare costs of maintaining these lazy good for nothings will bankrupt the developed world, causing a global financial Armageddon. This will lead to the masses begging their overlords for CBDCs, a living stipend, tiny government issued hovels, and technological monitoring of all their communications. You will come to love your servitude in this brave new world. We took the world we had for granted. Now we will pay the price.
“Most human beings have an almost infinite capacity for taking things for granted.”― Aldous Huxley, Brave New World
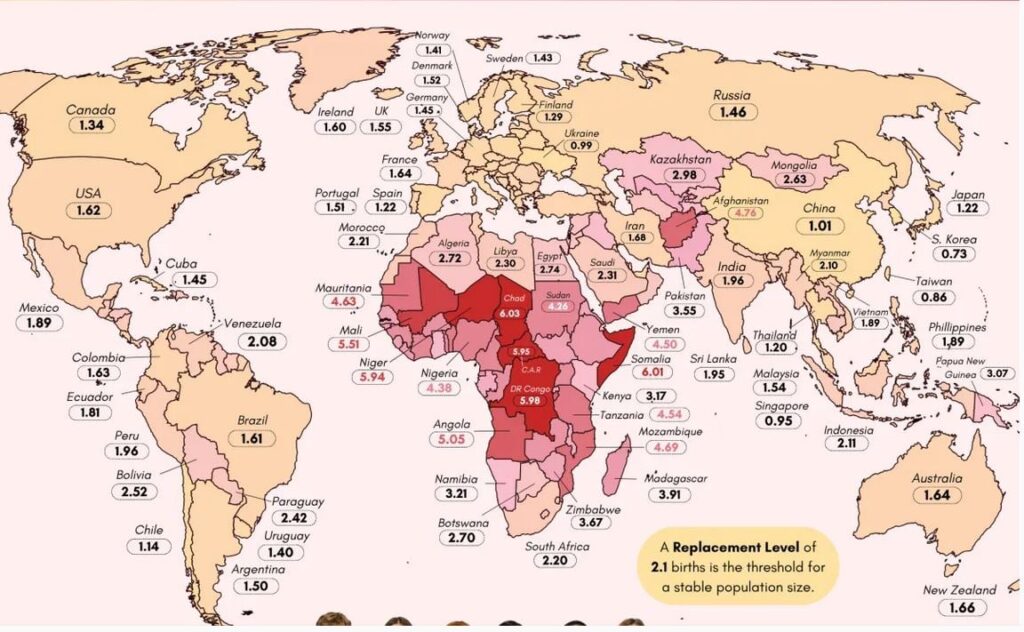
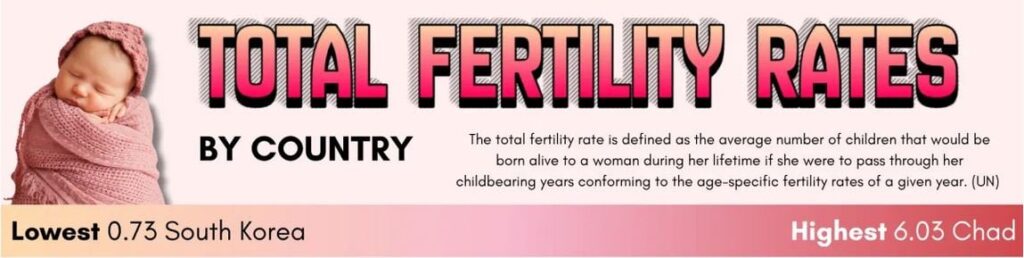
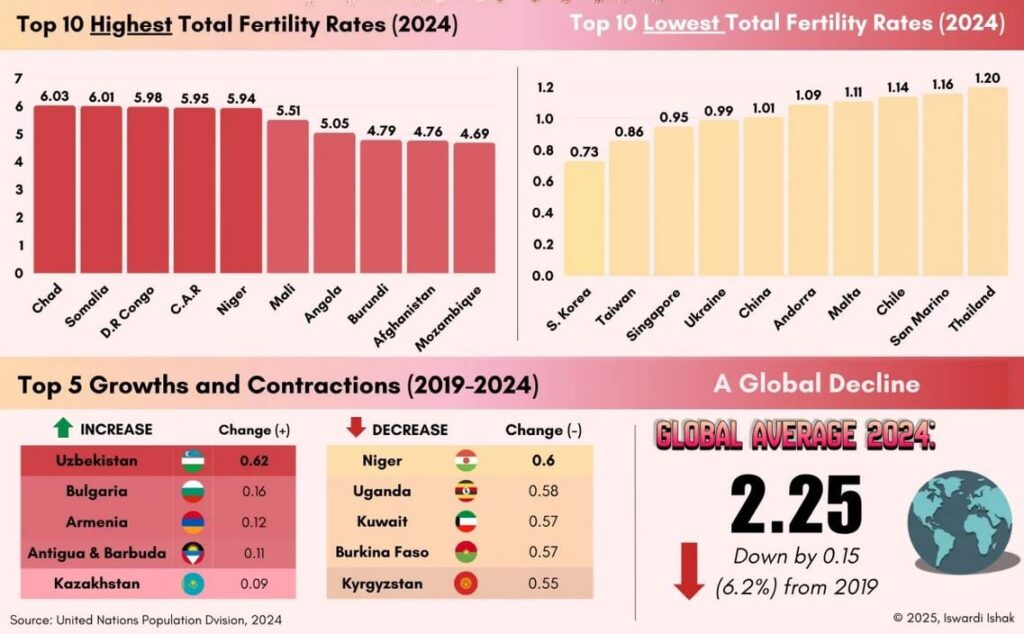
The world’s fertility rate continues its steady decline, averaging 2.25 children per woman, a 6.2% drop from 2019. The map reveals a striking global divide: countries in sub-Saharan Africa still record some of the world’s highest birth rates, with Chad leading at 6.03, while nations in East Asia and Europe see record lows, led by South Korea at just 0.73.
Despite this overall slowdown, some countries have bucked the trend. Uzbekistan, Bulgaria, and Armenia saw notable increases, while Niger, Uganda, and Kuwait experienced the sharpest declines. These shifts reflect the complex mix of economic, cultural, and policy factors influencing family planning worldwide.
As more countries fall below the population replacement rate of 2.1, the implications for labor forces, ageing populations, and future economic growth are becoming increasingly clear; signaling that the world’s demographic balance is rapidly changing.
Dataset
| Country | 2024 Total Fertility Rate | 2019 Total Fertility Rate | Change Between 2024 and 2019 |
|---|---|---|---|
| World | 2.248 | 2.397 | -0.149 |
| Afghanistan | 4.761 | 5.238 | -0.478 |
| Africa | 4.015 | 4.312 | -0.297 |
| Albania | 1.341 | 1.395 | -0.055 |
| Algeria | 2.723 | 2.997 | -0.275 |
| American Samoa | 2.267 | 2.404 | -0.137 |
| Americas | 1.738 | 1.852 | -0.114 |
| Andorra | 1.087 | 1.045 | 0.042 |
| Angola | 5.048 | 5.442 | -0.395 |
| Anguilla | 1.358 | 1.377 | -0.019 |
| Antigua and Barbuda | 1.582 | 1.468 | 0.114 |
| Argentina | 1.504 | 1.882 | -0.377 |
| Armenia | 1.716 | 1.601 | 0.115 |
| Aruba | 1.606 | 1.701 | -0.095 |
| Asia | 1.880 | 2.075 | -0.195 |
| Australia | 1.638 | 1.666 | -0.028 |
| Austria | 1.321 | 1.464 | -0.143 |
| Bahamas | 1.374 | 1.397 | -0.023 |
| Bahrain | 1.805 | 1.843 | -0.038 |
| Bangladesh | 2.138 | 2.180 | -0.042 |
| Barbados | 1.708 | 1.715 | -0.008 |
| Belarus | 1.217 | 1.389 | -0.172 |
| Belgium | 1.383 | 1.609 | -0.226 |
| Belize | 2.021 | 2.142 | -0.121 |
| Benin | 4.480 | 4.900 | -0.421 |
| Bermuda | 1.405 | 1.383 | 0.022 |
| Bhutan | 1.449 | 1.448 | 0.001 |
| Bolivia (Plurinational State of) | 2.523 | 2.688 | -0.165 |
| Bonaire, Sint Eustatius and Saba | 1.463 | 1.520 | -0.057 |
| Bosnia and Herzegovina | 1.492 | 1.509 | -0.017 |
| Botswana | 2.703 | 2.906 | -0.203 |
| Brazil | 1.614 | 1.705 | -0.091 |
| Brunei Darussalam | 1.731 | 1.819 | -0.088 |
| Bulgaria | 1.745 | 1.580 | 0.165 |
| Burkina Faso | 4.110 | 4.681 | -0.571 |
| Burundi | 4.789 | 5.271 | -0.482 |
| Cabo Verde | 1.511 | 1.698 | -0.187 |
| Cambodia | 2.548 | 2.725 | -0.176 |
| Cameroon | 4.261 | 4.651 | -0.390 |
| Canada | 1.343 | 1.476 | -0.132 |
| Caribbean | 1.970 | 2.084 | -0.114 |
| Cayman Islands | 1.525 | 1.508 | 0.017 |
| Central African Republic | 5.954 | 6.090 | -0.136 |
| Central America | 1.968 | 2.111 | -0.143 |
| Chad | 6.028 | 6.412 | -0.384 |
| Chile | 1.140 | 1.430 | -0.290 |
| China | 1.013 | 1.496 | -0.483 |
| China, Hong Kong SAR | 0.727 | 1.055 | -0.328 |
| China, Macao SAR | 0.676 | 0.936 | -0.260 |
| China, Taiwan Province of China | 0.863 | 1.045 | -0.182 |
| Colombia | 1.634 | 1.710 | -0.076 |
| Comoros | 3.822 | 4.138 | -0.316 |
| Congo | 4.109 | 4.380 | -0.271 |
| Cook Islands | 2.021 | 2.127 | -0.106 |
| Costa Rica | 1.318 | 1.600 | -0.281 |
| Côte d’Ivoire | 4.230 | 4.523 | -0.292 |
| Croatia | 1.472 | 1.470 | 0.002 |
| Cuba | 1.445 | 1.540 | -0.095 |
| Curaçao | 1.071 | 1.181 | -0.109 |
| Cyprus | 1.380 | 1.330 | 0.050 |
| Czechia | 1.456 | 1.753 | -0.297 |
| Dem. People’s Rep. of Korea | 1.784 | 1.825 | -0.041 |
| Dem. Rep. of the Congo | 5.981 | 6.253 | -0.272 |
| Denmark | 1.517 | 1.698 | -0.180 |
| Developed regions | 1.457 | 1.535 | -0.078 |
| Developing regions | 2.356 | 2.524 | -0.168 |
| Djibouti | 2.618 | 2.798 | -0.180 |
| Dominica | 1.480 | 1.504 | -0.024 |
| Dominican Republic | 2.222 | 2.366 | -0.144 |
| Ecuador | 1.806 | 2.035 | -0.229 |
| Egypt | 2.735 | 2.870 | -0.135 |
| El Salvador | 1.768 | 1.838 | -0.070 |
| Equatorial Guinea | 4.116 | 4.429 | -0.313 |
| Eritrea | 3.680 | 3.997 | -0.317 |
| Estonia | 1.363 | 1.661 | -0.299 |
| Eswatini | 2.718 | 2.925 | -0.207 |
| Ethiopia | 3.909 | 4.347 | -0.438 |
| Faroe Islands | 2.223 | 2.399 | -0.176 |
| Fiji | 2.270 | 2.385 | -0.115 |
| Finland | 1.291 | 1.351 | -0.060 |
| France | 1.636 | 1.826 | -0.190 |
| French Guiana | 3.341 | 3.732 | -0.392 |
| French Polynesia | 1.491 | 1.567 | -0.076 |
| Gabon | 3.592 | 3.884 | -0.291 |
| Gambia | 3.907 | 4.330 | -0.423 |
| Georgia | 1.802 | 2.021 | -0.219 |
| Germany | 1.448 | 1.541 | -0.093 |
| Ghana | 3.344 | 3.593 | -0.250 |
| Gibraltar | 1.885 | 1.912 | -0.026 |
| Greece | 1.336 | 1.337 | -0.001 |
| Greenland | 1.931 | 2.006 | -0.075 |
| Grenada | 1.472 | 1.542 | -0.070 |
| Guadeloupe | 2.073 | 2.149 | -0.075 |
| Guam | 2.748 | 2.938 | -0.190 |
| Guatemala | 2.287 | 2.593 | -0.306 |
| Guernsey | 1.366 | 1.323 | 0.043 |
| Guinea | 4.131 | 4.576 | -0.445 |
| Guinea-Bissau | 3.757 | 4.153 | -0.397 |
| Guyana | 2.395 | 2.521 | -0.126 |
| Haiti | 2.625 | 2.862 | -0.237 |
| Honduras | 2.476 | 2.611 | -0.135 |
| Hungary | 1.491 | 1.531 | -0.040 |
| India | 1.962 | 2.120 | -0.158 |
| Indonesia | 2.115 | 2.205 | -0.090 |
| Iran (Islamic Republic of) | 1.684 | 1.766 | -0.082 |
| Iraq | 3.221 | 3.480 | -0.258 |
| Ireland | 1.597 | 1.718 | -0.121 |
| Isle of Man | 1.544 | 1.606 | -0.062 |
| Israel | 2.785 | 3.034 | -0.249 |
| Italy | 1.206 | 1.259 | -0.053 |
| Jamaica | 1.351 | 1.390 | -0.039 |
| Japan | 1.217 | 1.323 | -0.107 |
| Jersey | 1.374 | 1.360 | 0.014 |
| Jordan | 2.604 | 2.855 | -0.251 |
| Kazakhstan | 2.984 | 2.890 | 0.094 |
| Kenya | 3.167 | 3.433 | -0.266 |
| Kiribati | 3.124 | 3.290 | -0.166 |
| Kosovo (under UNSC res. 1244) | 1.538 | 1.575 | -0.036 |
| Kuwait | 1.515 | 2.087 | -0.572 |
| Kyrgyzstan | 2.779 | 3.330 | -0.551 |
| Lao People’s Dem. Republic | 2.397 | 2.589 | -0.192 |
| Latvia | 1.342 | 1.609 | -0.267 |
| Lebanon | 2.227 | 2.327 | -0.099 |
| Lesotho | 2.664 | 2.924 | -0.260 |
| Liberia | 3.864 | 4.257 | -0.393 |
| Libya | 2.298 | 2.539 | -0.241 |
| Liechtenstein | 1.537 | 1.483 | 0.054 |
| Lithuania | 1.211 | 1.610 | -0.400 |
| LLDC | Asia | 3.072 | 3.118 |
| Luxembourg | 1.399 | 1.343 | 0.056 |
| Madagascar | 3.912 | 4.221 | -0.309 |
| Malawi | 3.590 | 3.952 | -0.363 |
| Malaysia | 1.543 | 1.777 | -0.234 |
| Maldives | 1.560 | 1.640 | -0.080 |
| Mali | 5.510 | 5.892 | -0.381 |
| Malta | 1.106 | 1.150 | -0.044 |
| Marshall Islands | 2.864 | 3.012 | -0.148 |
| Martinique | 1.992 | 2.025 | -0.033 |
| Mauritania | 4.625 | 4.984 | -0.358 |
| Mauritius | 1.225 | 1.351 | -0.125 |
| Mayotte | 4.562 | 4.580 | -0.018 |
| Melanesia | 3.029 | 3.258 | -0.229 |
| Mexico | 1.892 | 2.020 | -0.128 |
| Micronesia | 2.825 | 2.975 | -0.150 |
| Micronesia (Fed. States of) | 2.743 | 2.883 | -0.140 |
| Middle Africa | 5.447 | 5.751 | -0.304 |
| Monaco | 2.102 | 2.403 | -0.301 |
| Mongolia | 2.632 | 3.008 | -0.376 |
| Montenegro | 1.799 | 1.814 | -0.016 |
| Montserrat | 1.447 | 1.865 | -0.418 |
| Morocco | 2.208 | 2.342 | -0.134 |
| Mozambique | 4.690 | 5.016 | -0.326 |
| Myanmar | 2.098 | 2.206 | -0.108 |
| Namibia | 3.211 | 3.404 | -0.193 |
| Nauru | 3.290 | 3.531 | -0.241 |
| Nepal | 1.961 | 2.080 | -0.119 |
| Netherlands | 1.434 | 1.572 | -0.138 |
| New Caledonia | 1.964 | 2.050 | -0.087 |
| New Zealand | 1.659 | 1.717 | -0.058 |
| Nicaragua | 2.206 | 2.321 | -0.115 |
| Niger | 5.935 | 6.537 | -0.602 |
| Nigeria | 4.382 | 4.861 | -0.479 |
| Niue | 2.488 | 2.629 | -0.141 |
| North Macedonia | 1.467 | 1.651 | -0.184 |
| Northern Africa and Western Asia | 2.714 | 2.881 | -0.167 |
| Northern America | 1.594 | 1.664 | -0.070 |
| Northern Mariana Islands | 2.324 | 2.559 | -0.235 |
| Norway | 1.410 | 1.533 | -0.123 |
| Oceania | 2.137 | 2.199 | -0.062 |
| Oman | 2.508 | 2.696 | -0.188 |
| Pakistan | 3.547 | 3.810 | -0.263 |
| Palau | 1.883 | 1.984 | -0.101 |
| Panama | 2.106 | 2.288 | -0.182 |
| Papua New Guinea | 3.072 | 3.322 | -0.250 |
| Paraguay | 2.416 | 2.525 | -0.109 |
| Peru | 1.965 | 2.086 | -0.121 |
| Philippines | 1.894 | 2.215 | -0.321 |
| Poland | 1.304 | 1.436 | -0.132 |
| Polynesia | 2.523 | 2.653 | -0.130 |
| Portugal | 1.514 | 1.421 | 0.093 |
| Puerto Rico | 0.939 | 0.979 | -0.040 |
| Qatar | 1.717 | 1.731 | -0.014 |
| Republic of Korea | 0.734 | 0.881 | -0.147 |
| Republic of Moldova | 1.726 | 1.780 | -0.054 |
| Réunion | 2.151 | 2.133 | 0.018 |
| Romania | 1.711 | 1.711 | 0.000 |
| Russian Federation | 1.457 | 1.504 | -0.047 |
| Rwanda | 3.645 | 3.985 | -0.341 |
| Saint Barthélemy | 0.815 | 0.734 | 0.081 |
| Saint Helena | 1.639 | 1.668 | -0.029 |
| Saint Kitts and Nevis | 1.526 | 1.568 | -0.043 |
| Saint Lucia | 1.385 | 1.424 | -0.039 |
| Saint Martin (French part) | 2.673 | 2.791 | -0.117 |
| Saint Pierre and Miquelon | 1.273 | 1.358 | -0.085 |
| Saint Vincent and the Grenadines | 1.761 | 1.864 | -0.103 |
| Samoa | 3.801 | 4.061 | -0.260 |
| San Marino | 1.158 | 1.096 | 0.062 |
| Sao Tome and Principe | 3.596 | 3.900 | -0.304 |
| Saudi Arabia | 2.308 | 2.490 | -0.182 |
| Senegal | 3.765 | 4.100 | -0.335 |
| Serbia | 1.499 | 1.513 | -0.014 |
| Seychelles | 2.109 | 2.262 | -0.153 |
| Sierra Leone | 3.703 | 4.192 | -0.489 |
| Singapore | 0.952 | 0.942 | 0.010 |
| Sint Maarten (Dutch part) | 1.440 | 1.481 | -0.041 |
| Slovakia | 1.563 | 1.566 | -0.003 |
| Slovenia | 1.576 | 1.611 | -0.035 |
| Solomon Islands | 3.513 | 3.800 | -0.287 |
| Somalia | 6.013 | 6.560 | -0.547 |
| South Africa | 2.205 | 2.264 | -0.059 |
| South Sudan | 3.785 | 4.260 | -0.475 |
| South-Eastern Asia | 1.923 | 2.058 | -0.135 |
| Southern Africa | 2.288 | 2.362 | -0.074 |
| Southern Asia | 2.203 | 2.347 | -0.144 |
| Southern Europe | 1.289 | 1.318 | -0.029 |
| Spain | 1.221 | 1.230 | -0.009 |
| Sri Lanka | 1.952 | 2.022 | -0.069 |
| State of Palestine | 3.250 | 3.591 | -0.341 |
| Sudan | 4.264 | 4.617 | -0.353 |
| Suriname | 2.231 | 2.347 | -0.116 |
| Sweden | 1.434 | 1.709 | -0.275 |
| Switzerland | 1.438 | 1.478 | -0.040 |
| Syrian Arab Republic | 2.700 | 2.878 | -0.178 |
| Tajikistan | 3.036 | 3.281 | -0.245 |
| Thailand | 1.204 | 1.285 | -0.082 |
| Timor-Leste | 2.627 | 3.116 | -0.489 |
| Togo | 4.122 | 4.450 | -0.329 |
| Tokelau | 2.599 | 2.745 | -0.147 |
| Tonga | 3.100 | 3.274 | -0.174 |
| Trinidad and Tobago | 1.536 | 1.578 | -0.043 |
| Tunisia | 1.818 | 2.100 | -0.282 |
| Türkiye | 1.621 | 1.886 | -0.266 |
| Turkmenistan | 2.661 | 2.834 | -0.173 |
| Turks and Caicos Islands | 1.452 | 1.617 | -0.165 |
| Tuvalu | 3.174 | 3.331 | -0.157 |
| Uganda | 4.165 | 4.744 | -0.579 |
| Ukraine | 0.988 | 1.218 | -0.230 |
| United Arab Emirates | 1.213 | 1.247 | -0.033 |
| United Kingdom | 1.551 | 1.632 | -0.081 |
| United Republic of Tanzania | 4.541 | 4.866 | -0.325 |
| United States of America | 1.622 | 1.684 | -0.062 |
| United States Virgin Islands | 2.081 | 2.162 | -0.081 |
| Uruguay | 1.397 | 1.567 | -0.170 |
| Uzbekistan | 3.486 | 2.869 | 0.617 |
| Vanuatu | 3.569 | 3.790 | -0.221 |
| Venezuela | 2.077 | 2.131 | -0.054 |
| Viet Nam | 1.895 | 1.943 | -0.048 |
| Wallis and Futuna Islands | 1.405 | 2.048 | -0.643 |
| Western Sahara | 2.177 | 2.281 | -0.104 |
| Yemen | 4.499 | 4.603 | -0.104 |
| British Virgin Islands | 1.048 | 0.941 | 0.107 |
| Zambia | 4.036 | 4.418 | -0.382 |
| Zimbabwe | 3.674 | 3.748 | -0.074 |
Data sources
____
https://www.theburningplatform.com/2025/11/16/if-demographics-is-destiny-were-screwed/